Version 2.2.1.824 of Mumbai is available for download. Here’s the list of changes:
- Added ASH data viewer (supports ASH and BASH data)
- Added one-click 10046 tracing for scripts in the console window
- Lots of small tweaks and fixes
After releasing the BASH package that makes active session history data available without a Diagnostic Pack license, an ASH data viewer in Mumbai was the logical next step.
The layout as shown below is similar to what you might know from the ASH data shown in Enterprise Manager/Cloud Control/DB Console or from ASH Viewer, but there are, in my opinion, a few features and options that let you dig the ASH data a bit deeper.
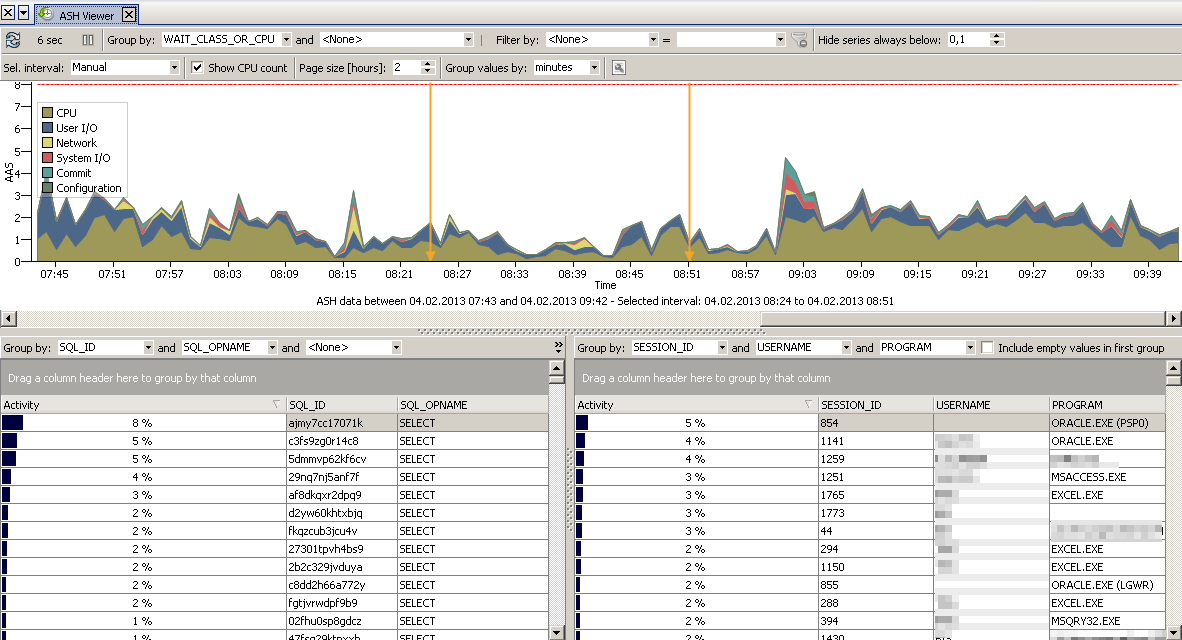
At the top there is the ASH graph over a time scale and you can select an interval with the mouse or use an automatic selection like “Last 5 minutes” from the selection box on the toolbar. The yellow arrows mark the beginning and end of the selected interval.
At the lower half of the window you see details for the selected time period.
New ASH data is fetched every 15 seconds or whenever you click the update button on the toolbar.
The optional red line shows the CPU count for the database server.
Until here it’s probably what you know from other ASH visualizations.
The ASH data is grouped by minutes or hours (whatever you selected on the toolbar). The grouping by hour produces a more regularly shaped graph when you look at long time intervals. You can also set the number of hours that you want to see without scrolling the graph (“Page size [hours]”).
When looking at longer time intervals, days are separated by grey lines:

A very useful feature are the grouping and filter options, so you don’t have to look at the data by the standard WAIT_CLASS_OR_CPU, but you can group by wait event, terminal, module or whatever column there is in V$ACTIVE_SESSION_HISTORY.
Further there is a simple “equal” filter, in case you want to look at the data from just one session, module, user, etc. or just at one specific wait event or wait class.
For the detail data of the selected interval at the lower half of the window you can group by up to three different columns.
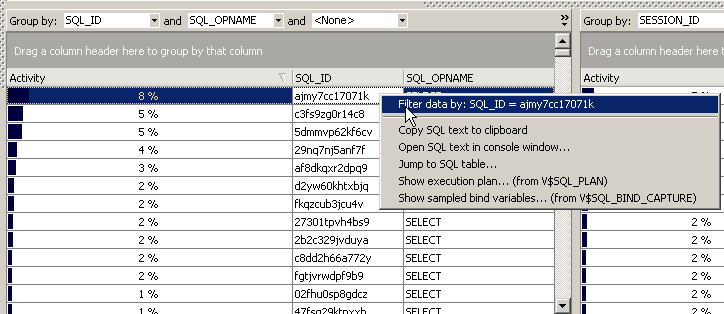
You can right click on the detail data grids to quickly filter the graph at the top by the contents of the selected cell. Further for some columns (e.g. SESSION_ID, SQL_ID) there are some menu actions available:
When you click the ASH icon in Mumbai you are first asked which data Mumbai should select from:
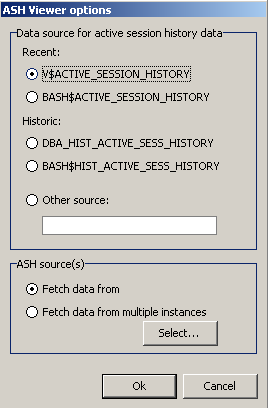
You can select the recent ASH or BASH data or the historical ASH or BASH data by selecting the appropriate views.
Further note that you can select data from more than one instance. This might be useful, e.g. for analyzing I/O load from multiple instances running against the same SAN. If you select the multi-instance option, the ASH data will have an additional column DB_SOURCE, so you can group and filter by the source database later.
Next you need to specify for which interval you want to fetch the ASH/BASH data:
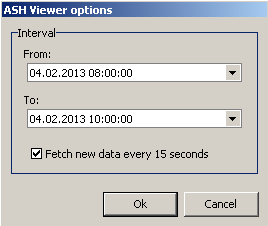
The “Fetch new data every 15 seconds” option is only available when you select the latest “To” time (which is always rounded up to the next full hour).
I suggest you start with 2 hour intervals for recent ASH data or up to 24 hour intervals for historic ASH data to see if Mumbai can handle the amount of data and go up from there if you need to.
Some additional features:
- You can click on a series name in the legend to mark it yellow. Click again to go back to the default color
- Double click within the legend (but not on a series name) to move it to the other side in case it’s in you way.
- Note that as default series with values always below 0,1 Average Active Sessions are not shown in the graph, so that irrelevant series do not clutter up the graph. You might need to set it to 0 sometimes to see what you are looking for.
I’ve tested the ASH data viewer in Mumbai for about a months now and it was extremely useful for me (together with BASH). I hope you like it, too! 🙂


This is awesome! Just a few days ago I found your BASH and thought, this would be a good addition to Mumbai, and here it is. Thanks for sharing this great tool!
Thanks Gerrit! Good to hear you like it! 🙂
Hi Marcus
Does this work on RAC systems?
Thanks
It’s not tested on RAC systems, but I see no problems.
When you start the ASH data viewer in Mumbai you are asked which data to fetch and you can either select V$ACTIVE_SESSION_HISTORY or you could manually specify GV$ACTIVE_SESSION_HISTORY in the text input field, if you want to see data from all instances.
This is really awesome tool, it the main principal of sampling is the same as S-ASH from Marcin ?
By chance, have you compared his implementation with yours, I guess it is the same method of bulk collecting session and stat info and dump them into tables ?
If I remember correctly in S-ASH, the table containing the raw data was split into 24 tables and a view would make the data as a single table. Have you implemented the same type of manual partitionning for Historic data ?
Thanks.
I’d say that BASH is more a lightweight implementation, but with the same principal as in S-ASH. S-ASH has a central database where ASH data from lots of databases can be kept, which I suppose is quite useful in large environments. I needed something simpler and so in the BASH setup (collecting ASH data for and keeping it in the same database) I saw no need for partitioning.
You did a great job here, and I’d like to thank you. Could you please tell me how to calculate CPU Used that you use on the charts?
Thank you again.
Only active sessions are sampled to (B)ASH. An active session can either wait or is on the CPU, so
SELECT * FROM BASH$ACTIVE_SESSION_HISTORY where session_state<>’WAITING’
will give you all sessions that were on the CPU. And this
SELECT SAMPLE_TIME, count(*)
FROM bash$active_session_history
WHERE session_state<>’WAITING’
AND SAMPLE_TIME > sysdate – (5/(24*60))
GROUP BY SAMPLE_TIME
ORDER BY 1 desc;
will give you the number of active session on the CPU in each second in the last 5 minutes. You might want to group this by minute instead of seconds.
Marcus,
This is one of the very few tools I can customize what table I am reading ASH data from.
I think the tool reads in the whole table at the beginning, my 24h ASH data grew the memory used by Mumbai by 2GB, luckily I had that much to spare. It took several minutes, but after that I was able to browse the info, great!
Other tools try to read the table (scan on dba_active_sess_history) every time I browse, which makes them unusable for my data set. On the other hand, this limits me to how much memory I have, right?
Also, would it be possible to customize “Fetch new data every 15 seconds”?
I test run shorter sql-s, it would be nice to see them faster in ASH viewer.
Thanks for this great tool,
Zoltan
Hi Zoltan,
you are right. Mumbai will fetch all data to local memory first. You can limit the amount of data by selecting smaller time periods through the From/To fields or by fetching from DBA_HIST_ACTIVE_SESS_HISTORY instead of V$ACTIVE_SESSION_HISTORY.
If you want to use other tools to display your data, you might want to try to let the V$ACTIVE_SESSION_HISTORY synonym in point to another view/table.
Regarding the fetch interval: I’ve tried this with smaller intervals, but the GUI really gets sluggy.
Cheers,
Marcus