Following up on the the Oracle doubled the costs for database licenses on MS Azure and partly on AWS post, I wondered with which setup on which cloud provider you would get the most bang out of an Oracle SE2 database processor license and what the recent change in Oracle licensing means especially for Azure users.
I’ve done an overly simple CPU benchmark test against Azure, AWS and Oracle cloud instances to get a rough idea how they perform in comparison. I’ve used sysbench for this (details below), which basically spits out you the time it needs to find prime numbers.
The numbers
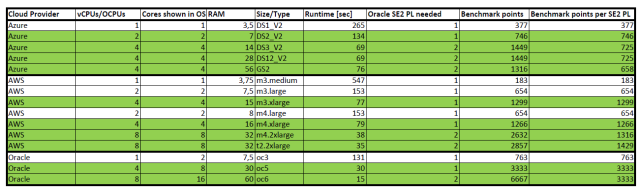
The green rows are setups that you would actually use – you would not select a server instance with just one or two cores if the Oracle database processor license allows you to use it for a server with more cores.
Results
One Oracle database SE2 processor license on Azure will get you only 22% of the CPU power compared to what you get in the Oracle cloud. With AWS you get around 40% of the CPU power compared to the Oracle cloud.
The real result
So, Larry was right?
What you get and how much you have to pay for it is a fast moving target in the cloud. An unnoticed change in “non-contractual” Oracle documents might easily double your licensing costs in the future.
Some Azure users have learned already that cloud can also mean that you have to roll out a new architecture and licensing model within 30 days.
Takeaway
Since you might currently feel a severe database vendor lock-in pain, you might want to think about ways to prevent cloud vendor lock-in:
- Infrastructure as code with multiple targets up from the start
- Private cloud on your own dedicated hardware or on bare metal cloud services
- Good-ol’ virtualization on-premises or on bare metal cloud services
Test details
All tests were done on instances using Oracle Linux 7.2, 7.3 or RHEL 7.3 images. If you want to try to reproduce the results, here’s what to do:
sudo yum -y install wget
wget https://dl.fedoraproject.org/pub/epel/epel-release-latest-7.noarch.rpm
sudo rpm -ivh epel-release-latest-7.noarch.rpm
sudo yum -y install htop sysbench
sudo yum -y update && sudo reboot

htop
# Wait until the post-reboot load goes down and feed the number of cores shown in htop into sysbench
sysbench --test=cpu --cpu-max-prime=100000 --num-threads=<core_count> run
This was just a quick and dirty test with a licensing focus, which ignores a multitude of points:
- Prime number calculation is not the same as Oracle database CPU load.
- Results might be skewed depending on which host machine your instances ends up on.
- It’s only a point-in-time test, not a statistically valid anaylsis over a longer period of time.
- This is a constantly moving target since cloud provider upgrade the underlying hardware.
- Probably a lot more…